Integrating Genetics and Genomics to Advance Soybean Research
 A table of the significantly differentially expressed genes between any two tissues. Gene lists can be downloaded directly from this interactive table.
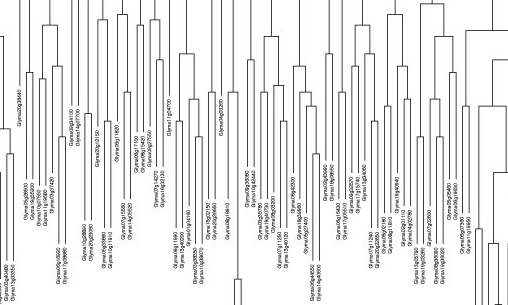 The hierarchical clustering method clusters genes into clades with similar expression profiles.
 Download raw and normalized data, supplementary figures, tables, and lists.
RNA-Seq Atlas of Glycine max:
A guide to the soybean transcriptome
Andrew J. Severin, Jenna L. Woody, Yung-Tsi Bolon, Bindu Joseph, Brian W. Diers, Andrew D. Farmer, Gary J. Muehlbauer, Rex T. Nelson, David Grant, James E. Specht, Michelle A. Graham, Steven B. Cannon, Gregory D. May, Carroll P. Vance and Randy C. Shoemaker
 This RNA-Seq atlas extends upon the analyses of previous gene expression atlases performed using Affymetrix GeneChip technology and describes new methods that compensate for the increase in transcriptome data obtained from next generation sequencing.
The RNA Seq-Atlas presented here provides high-resolution gene expression in a diverse set of fourteen tissues. Mining of these data suggests three clades of tissue (aerial, underground and seed) exhibiting transcriptionally similar profiles. For example, the analysis of the gene expression profiles of over 2,000 genes with preferential gene expression in seed suggests there are more than 177 genes with functional roles that complement or aid in the economically important seed filling process.
We provide a means for examine genes with differential gene expression between any two tissues. The list of genes with a significant increase in gene expression between the tissues can be found here. One application of this table is to explore the differential gene expression between two developmental time points in a tissue of interest to gain insight into the gene functions and thereby the biological processes that occur during particular stages of development.
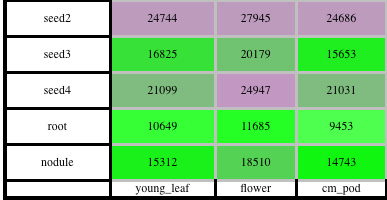
Additionally, we find that tissue specific gene expression of both the highest expressed genes and the genes specific to legumes is found in seed development and nodule tissues. Heatmaps effectively display gene expression profiles to easily identify genes with specific gene expression.
Finally We also investigate the relationship between gene structure and gene expression and find a correlation between gene length and gene expression. These tables along with figures, supplementary material and raw data are available for download.
 We are always interested in collaborations and welcome next-generation sequencing data to be deposited in SoyBase.
| Funded by the USDA-ARS. Developed by the USDA-ARS SoyBase and Legume Clade Database group at the Iowa State University, Ames, IA | ||
|
|

|
|
